


Advanced Investment Analytics Platform Developed by EncodeDots for Smarter Market Insights

About Project
EncodeDots developed a modern investment analytics platform aimed at helping investors explore market trends, track portfolio performance, and gain deeper insights into stock market activity.
Tech Stack
Design
 Figma
Figma
Frontend
Cloud
 AWS ECS
 ECR
ECR S3
S3 Application Load Balancer
 CloudWatch
Database
 PostgreSQL
 Redis
Redis
DevOps
 Docker
 Bitbucket Pipelines
The Challenges
Investors today rely heavily on digital platforms to monitor stock markets, analyze data, and evaluate potential investment opportunities. However, many existing platforms often present financial data in ways that are difficult for everyday investors to interpret.
Difficulty Understanding Market Trends
Many investors found it challenging to clearly understand stock market movements and evaluate how their investments were performing. Without simple visualization tools, interpreting market trends and making confident investment decisions became more difficult.
Limited Portfolio Visibility
Investors often wanted a platform where they could showcase their portfolios and explore how others were investing. Without a dedicated space to share and discover portfolios, it was harder to learn from successful traders and explore different investment strategies.
Complex Data Interpretation
Financial markets generate large amounts of numerical data, charts, and performance metrics. Without clear and structured visualization tools, many investors struggled to interpret this information and identify meaningful insights from market data.
Lack of Community-Driven Investment Insights
Many investors were interested in learning from a broader investment community. They needed a platform where they could discover trending portfolios, compare strategies, and gain inspiration from top-performing investors in the market.
The Solutions
A Smart Investment Analytics Platform Developed by EncodeDots
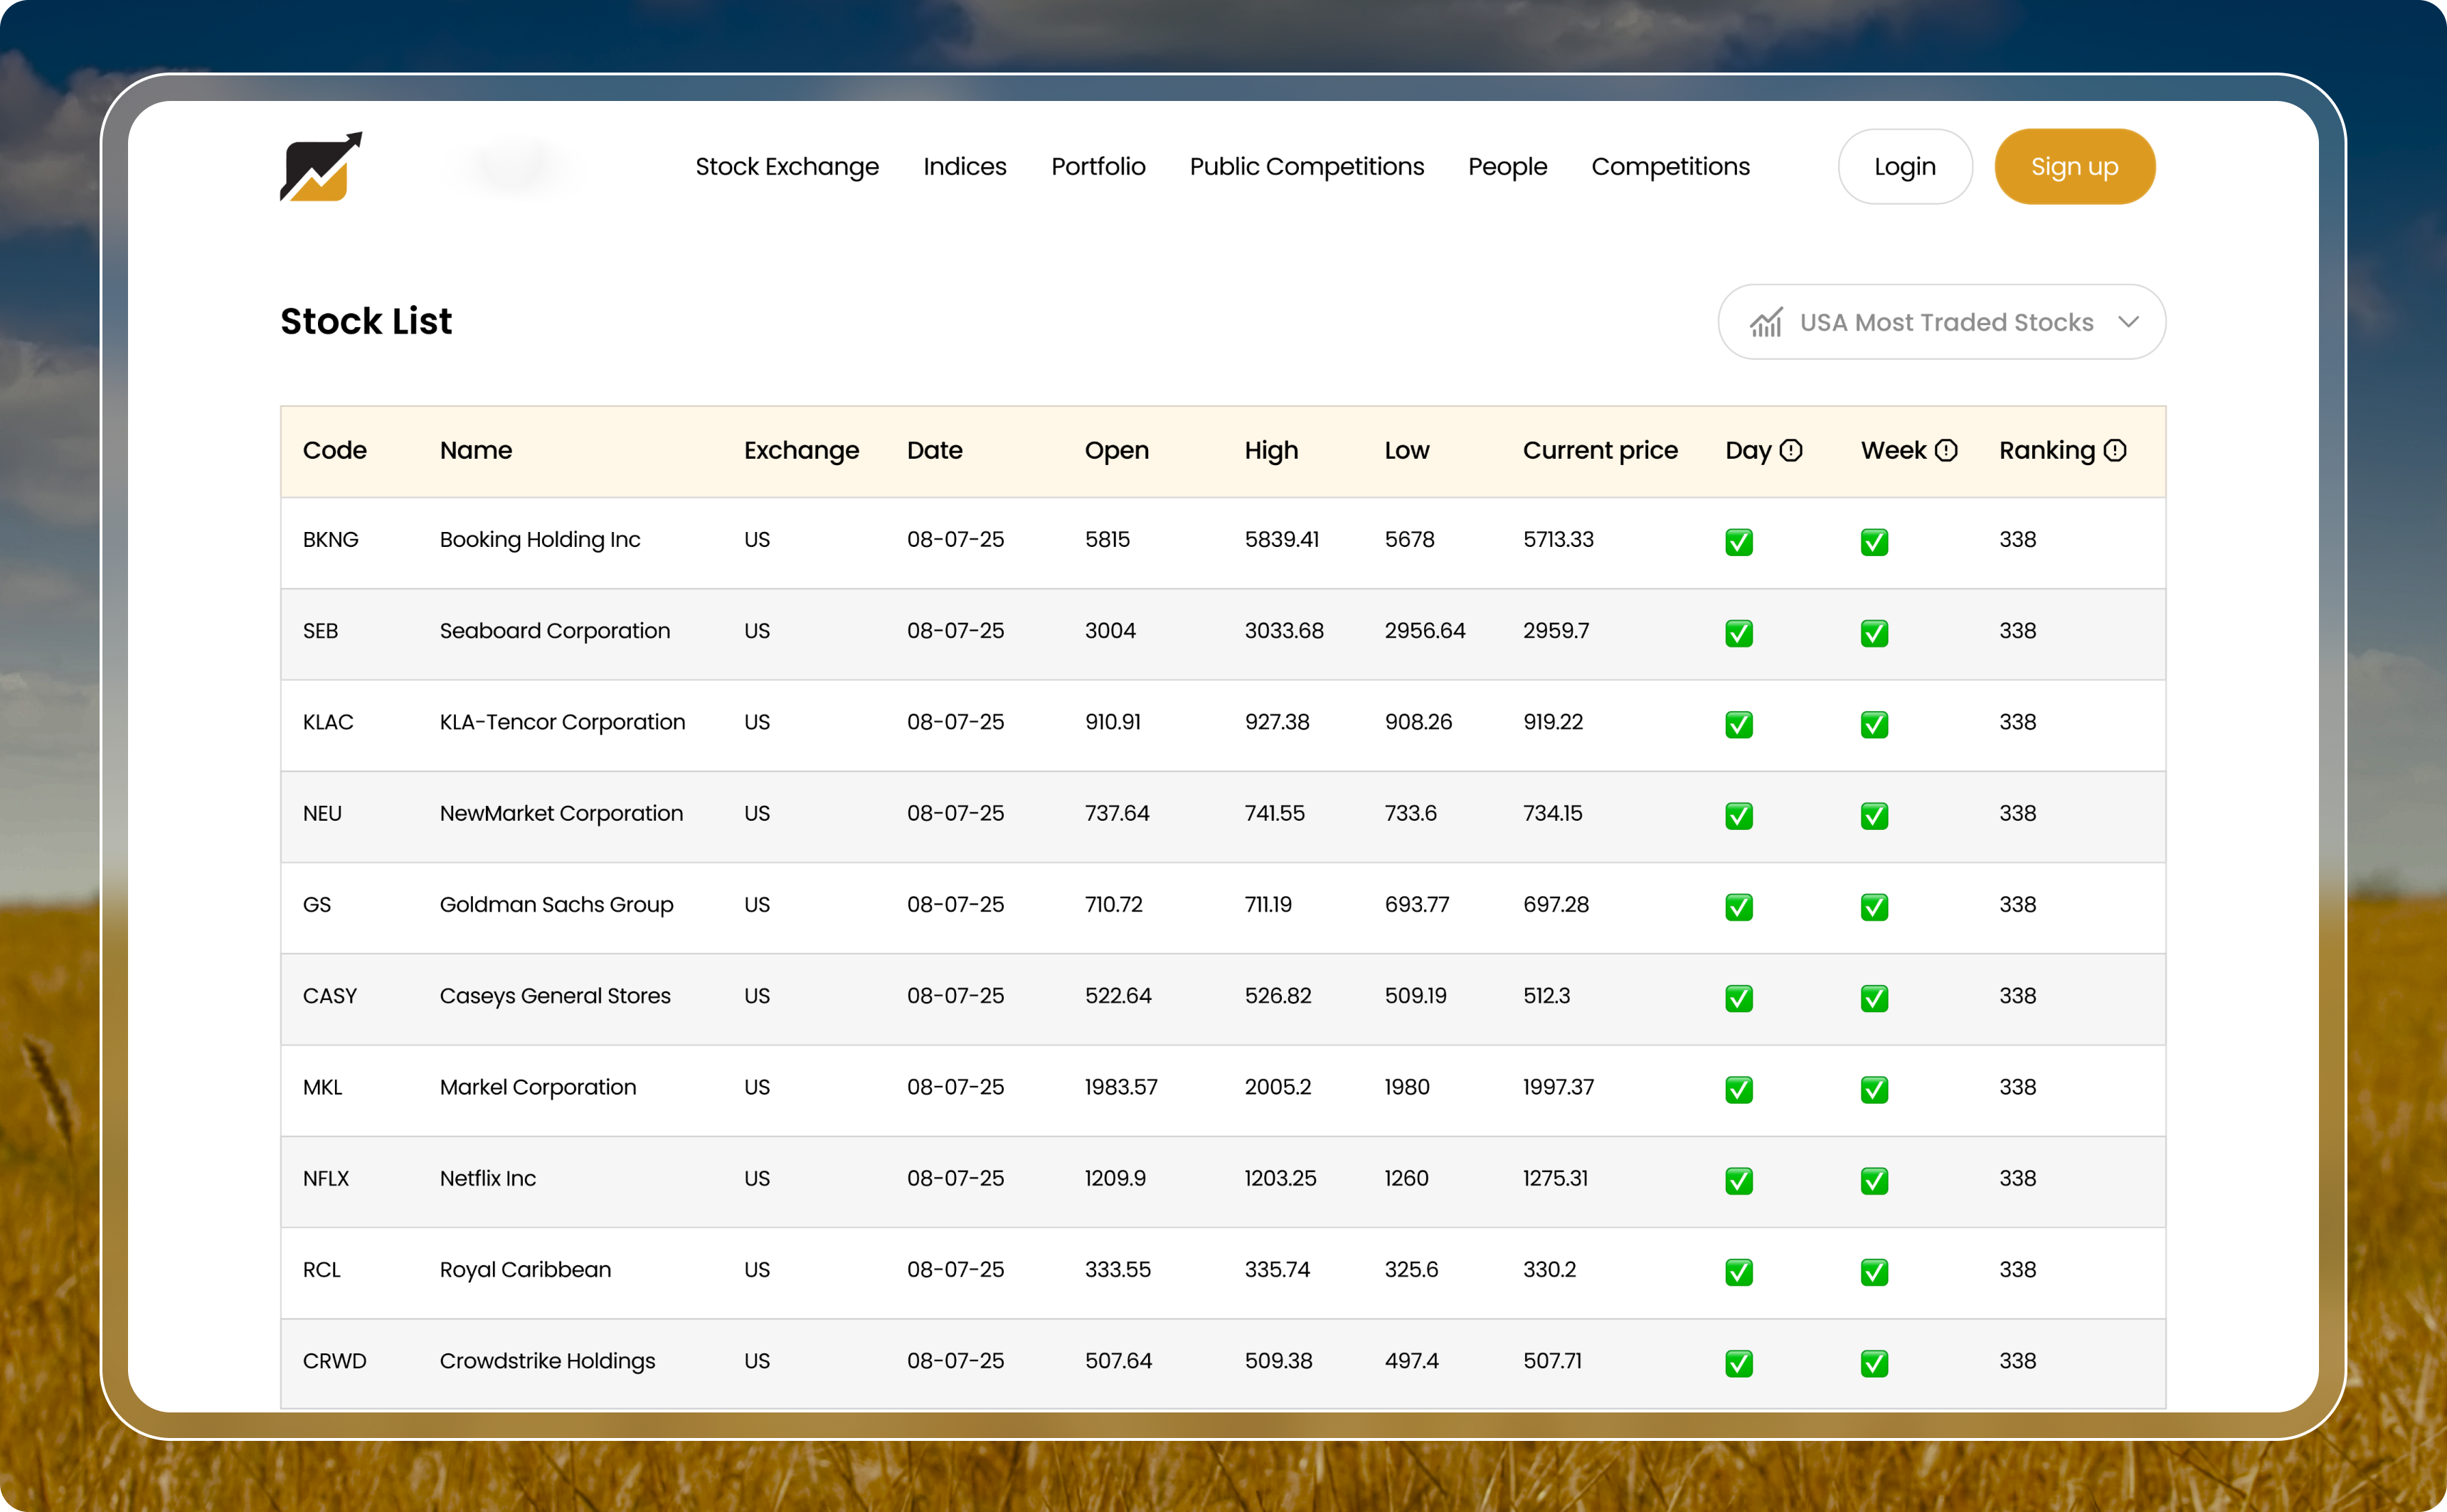
Interactive Market Data Dashboard
EncodeDots built a powerful analytics dashboard that presents stock market data through clear visual charts and well-structured tables. Investors can quickly analyze market movements, track performance trends, and gain a better understanding of how different stocks are performing.
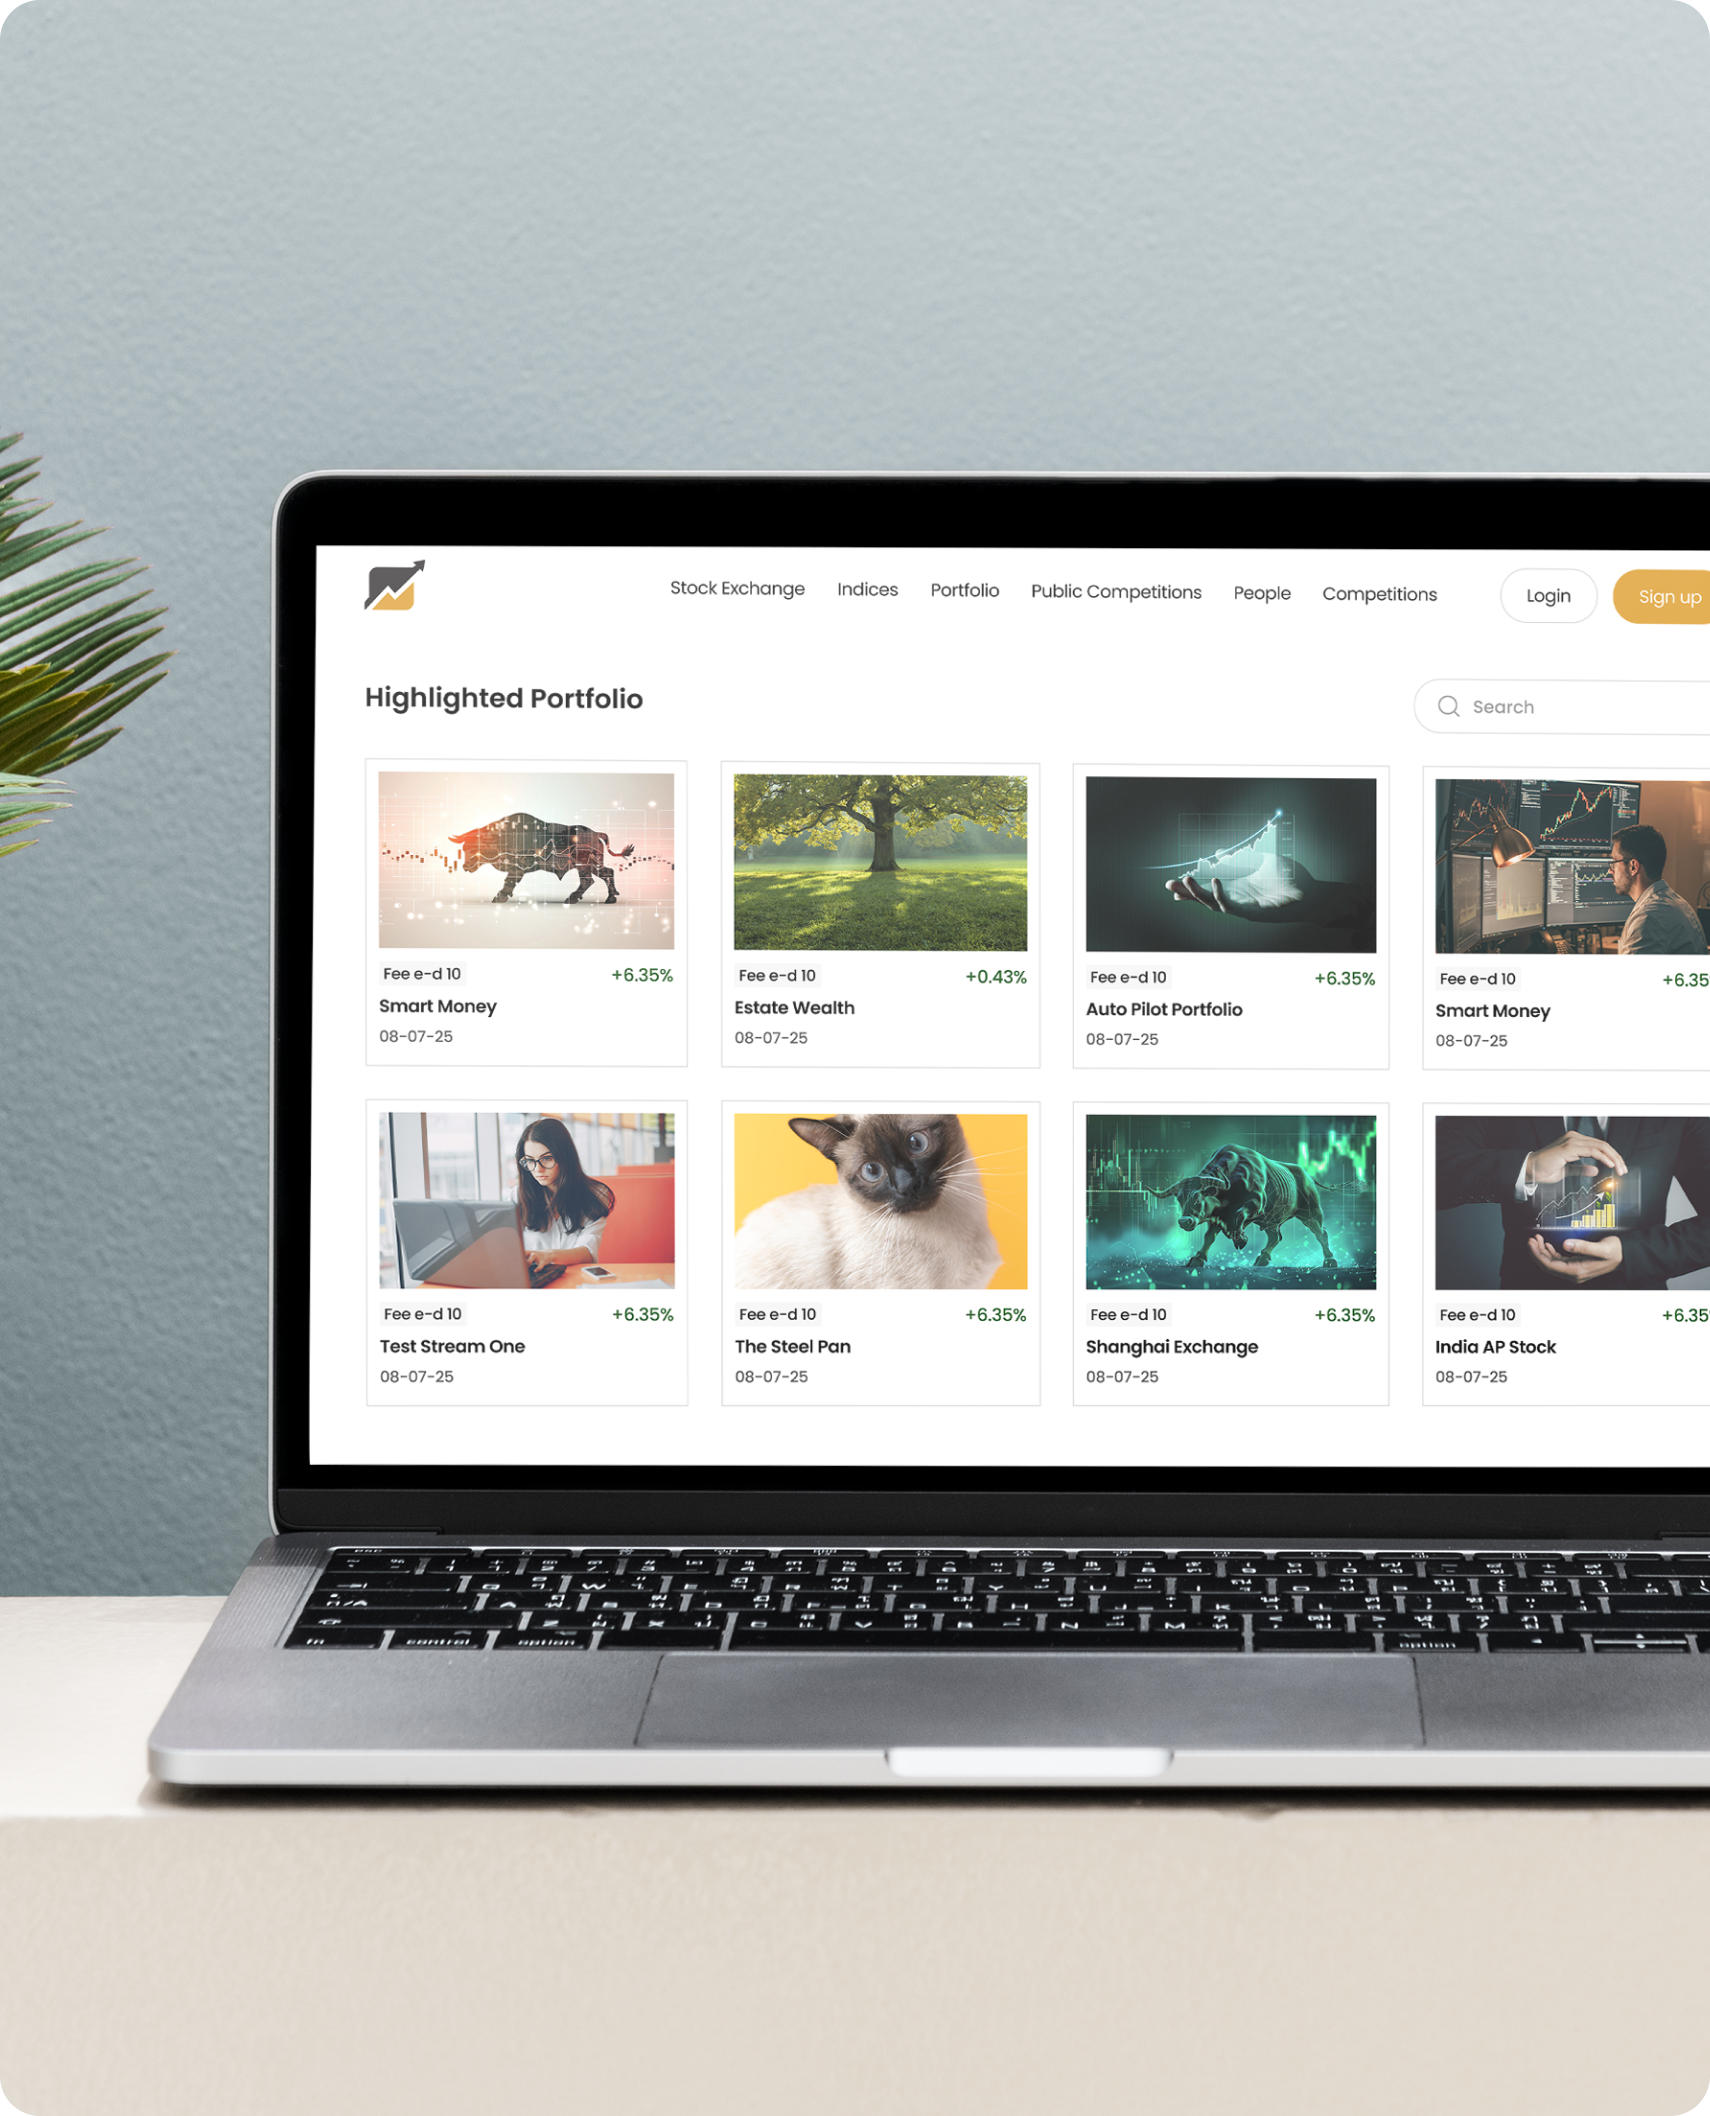
Portfolio Discovery System
The platform allows investors to publish and explore investment portfolios within the community. Users can discover portfolios from other traders, analyze their strategies, and gain inspiration for their own investment decisions.
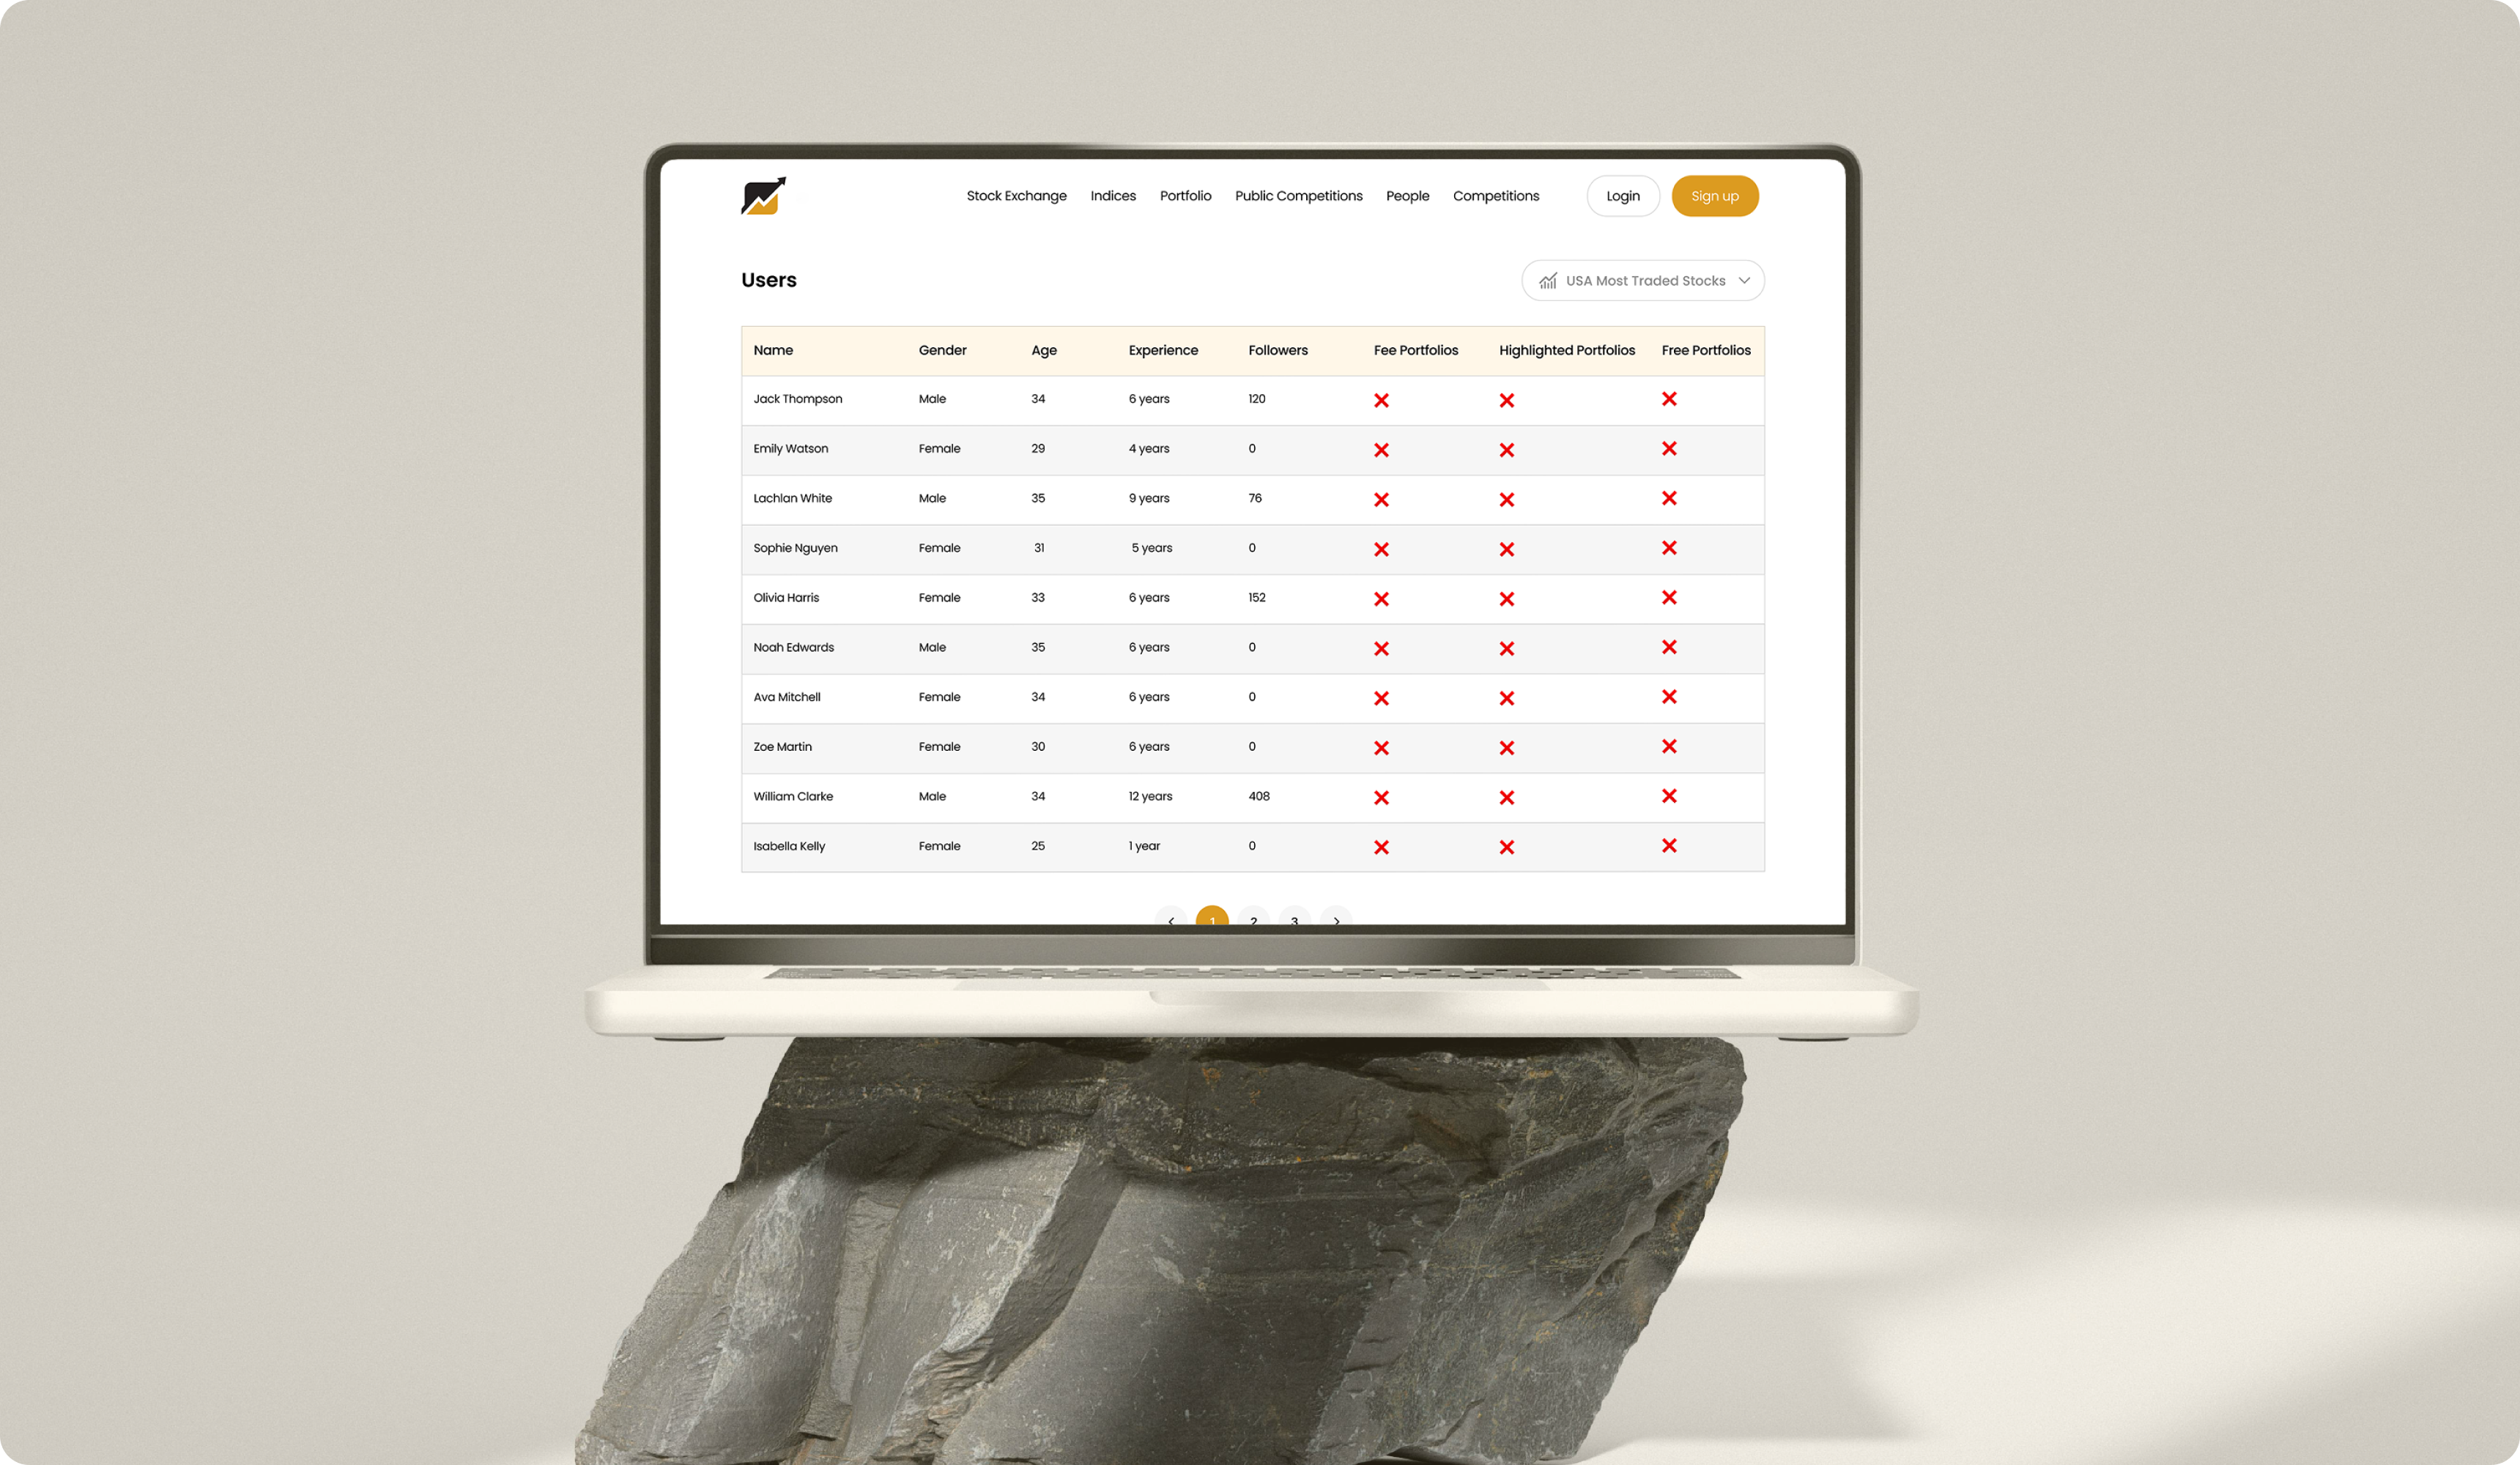
Investor Profile & Ranking System
A dedicated user system enables investors to create profiles, showcase their investment experience, and build credibility within the platform. Investors can gain followers, share insights, and appear in ranking lists based on their performance and engagement.
Market Performance Insights
The platform provides real-time performance metrics for stocks and portfolios, allowing investors to evaluate trends and compare investment opportunities. These insights help users make more informed decisions while navigating the dynamic stock market.
The Impacts
Before this platform was introduced, investors often relied on multiple tools to track stock data and analyze portfolios. With the comprehensive analytics solution developed by EncodeDots, users gained a centralized environment to explore market insights and track investment performance.
41%Increase in Investor Engagement on the Platform
56%Growth in Portfolio Discovery & Sharing
93%Improvement in User Experience with Market Analytics
67%Increase in User Interaction with Investment Data

Transforming Investment Intelligence: How EncodeDots Delivered a Smarter Financial Analytics Platform
Better Market Understanding
Investors gained a clearer view of stock performance and overall market activity through intuitive data visualizations and well-structured analytics. This made it easier to interpret trends and understand how different investments were performing.
Increased Community Interaction
The platform encouraged users to explore shared portfolios, follow experienced investors, and learn from different investment approaches. This created a more collaborative environment where investors could exchange ideas and discover new strategies.
Improved Investment Decision-Making
With access to organized market analytics and performance insights, investors could evaluate opportunities with greater confidence. The structured data helped users compare stocks and make more informed investment choices.
Stronger Investor Engagement
Interactive dashboards and portfolio discovery features kept users actively engaged with the platform. Investors regularly explored new portfolios, tracked market activity, and interacted with insights shared by the community.

How EncodeDots Built a Scalable Investment Analytics Platform
01.Research & Strategy
- Financial Market Analysis
- Investor Behavior Research
- Investment Platform Architecture Planning
- Data Visualization Strategy
02.Ideation & Planning
- User Journey Mapping
- Investment Feature Planning
- Portfolio & Data Architecture Design
- Platform Interaction Planning
03.Design Execution
- Fintech UI/UX Design
- Wireframe Creation
- High-Fidelity Dashboard Design
- Interactive Prototype Development
04.Development
- Frontend Application Development
- Backend API Development
- Financial Data Processing Integration
- Cloud Infrastructure Setup
05.Quality Assurance & Launch
- System Performance Testing
- Security & Data Validation
- Deployment & Launch
- Continuous Platform Improvements