


Intelligent Business Analytics Platform Developed by EncodeDots for Data-Driven Decision Making
About Project
This business analytics platform was developed by EncodeDots to help companies gain better visibility into their operations and performance metrics. Businesses often rely on multiple tools to track revenue, orders, customers, and inventory, which can make decision-making slower and less efficient.
Industry
Business Automation / Enterprise Solutions
Location
Australia
Tech Stack
Design
 Figma
Figma
Frontend
Cloud
 AWS ECS
 ECR
ECR S3
S3 CloudFront
 Route 53
 Application Load Balancer
 CloudWatch
Database
 PostgreSQL
 Redis
Redis MongoDB
DevOps
 Docker
 GitHub Actions
Payments & Accounting
 Stripe
 Xero
Xero QuickBooks
The Challenges
Modern businesses generate large volumes of operational and financial data every day. However, many organizations struggle to transform this data into meaningful insights that can support strategic decision-making.
Limited Visibility into Business Performance
Many organizations struggle to gain a clear overview of their business performance. Important data related to revenue, customer activity, and orders often exists across different tools, making it difficult for teams to understand overall growth and performance in one place.
Difficulty Tracking Sales and Operational Metrics
Business leaders need accurate performance indicators to monitor daily sales, order activity, and operational progress. Without a system that displays these metrics in real time, tracking business performance becomes slow and inefficient.
Slow Decision-Making
When business data is not easily accessible or clearly visualized, decision-making becomes delayed. Leadership teams often spend valuable time collecting information before they can evaluate performance and plan strategic actions.
Complicated Data Dashboards
Some analytics platforms are designed with highly technical interfaces that make data interpretation difficult for business teams. As a result, employees may struggle to understand reports, reducing the overall usefulness of business insights.
The Solutions
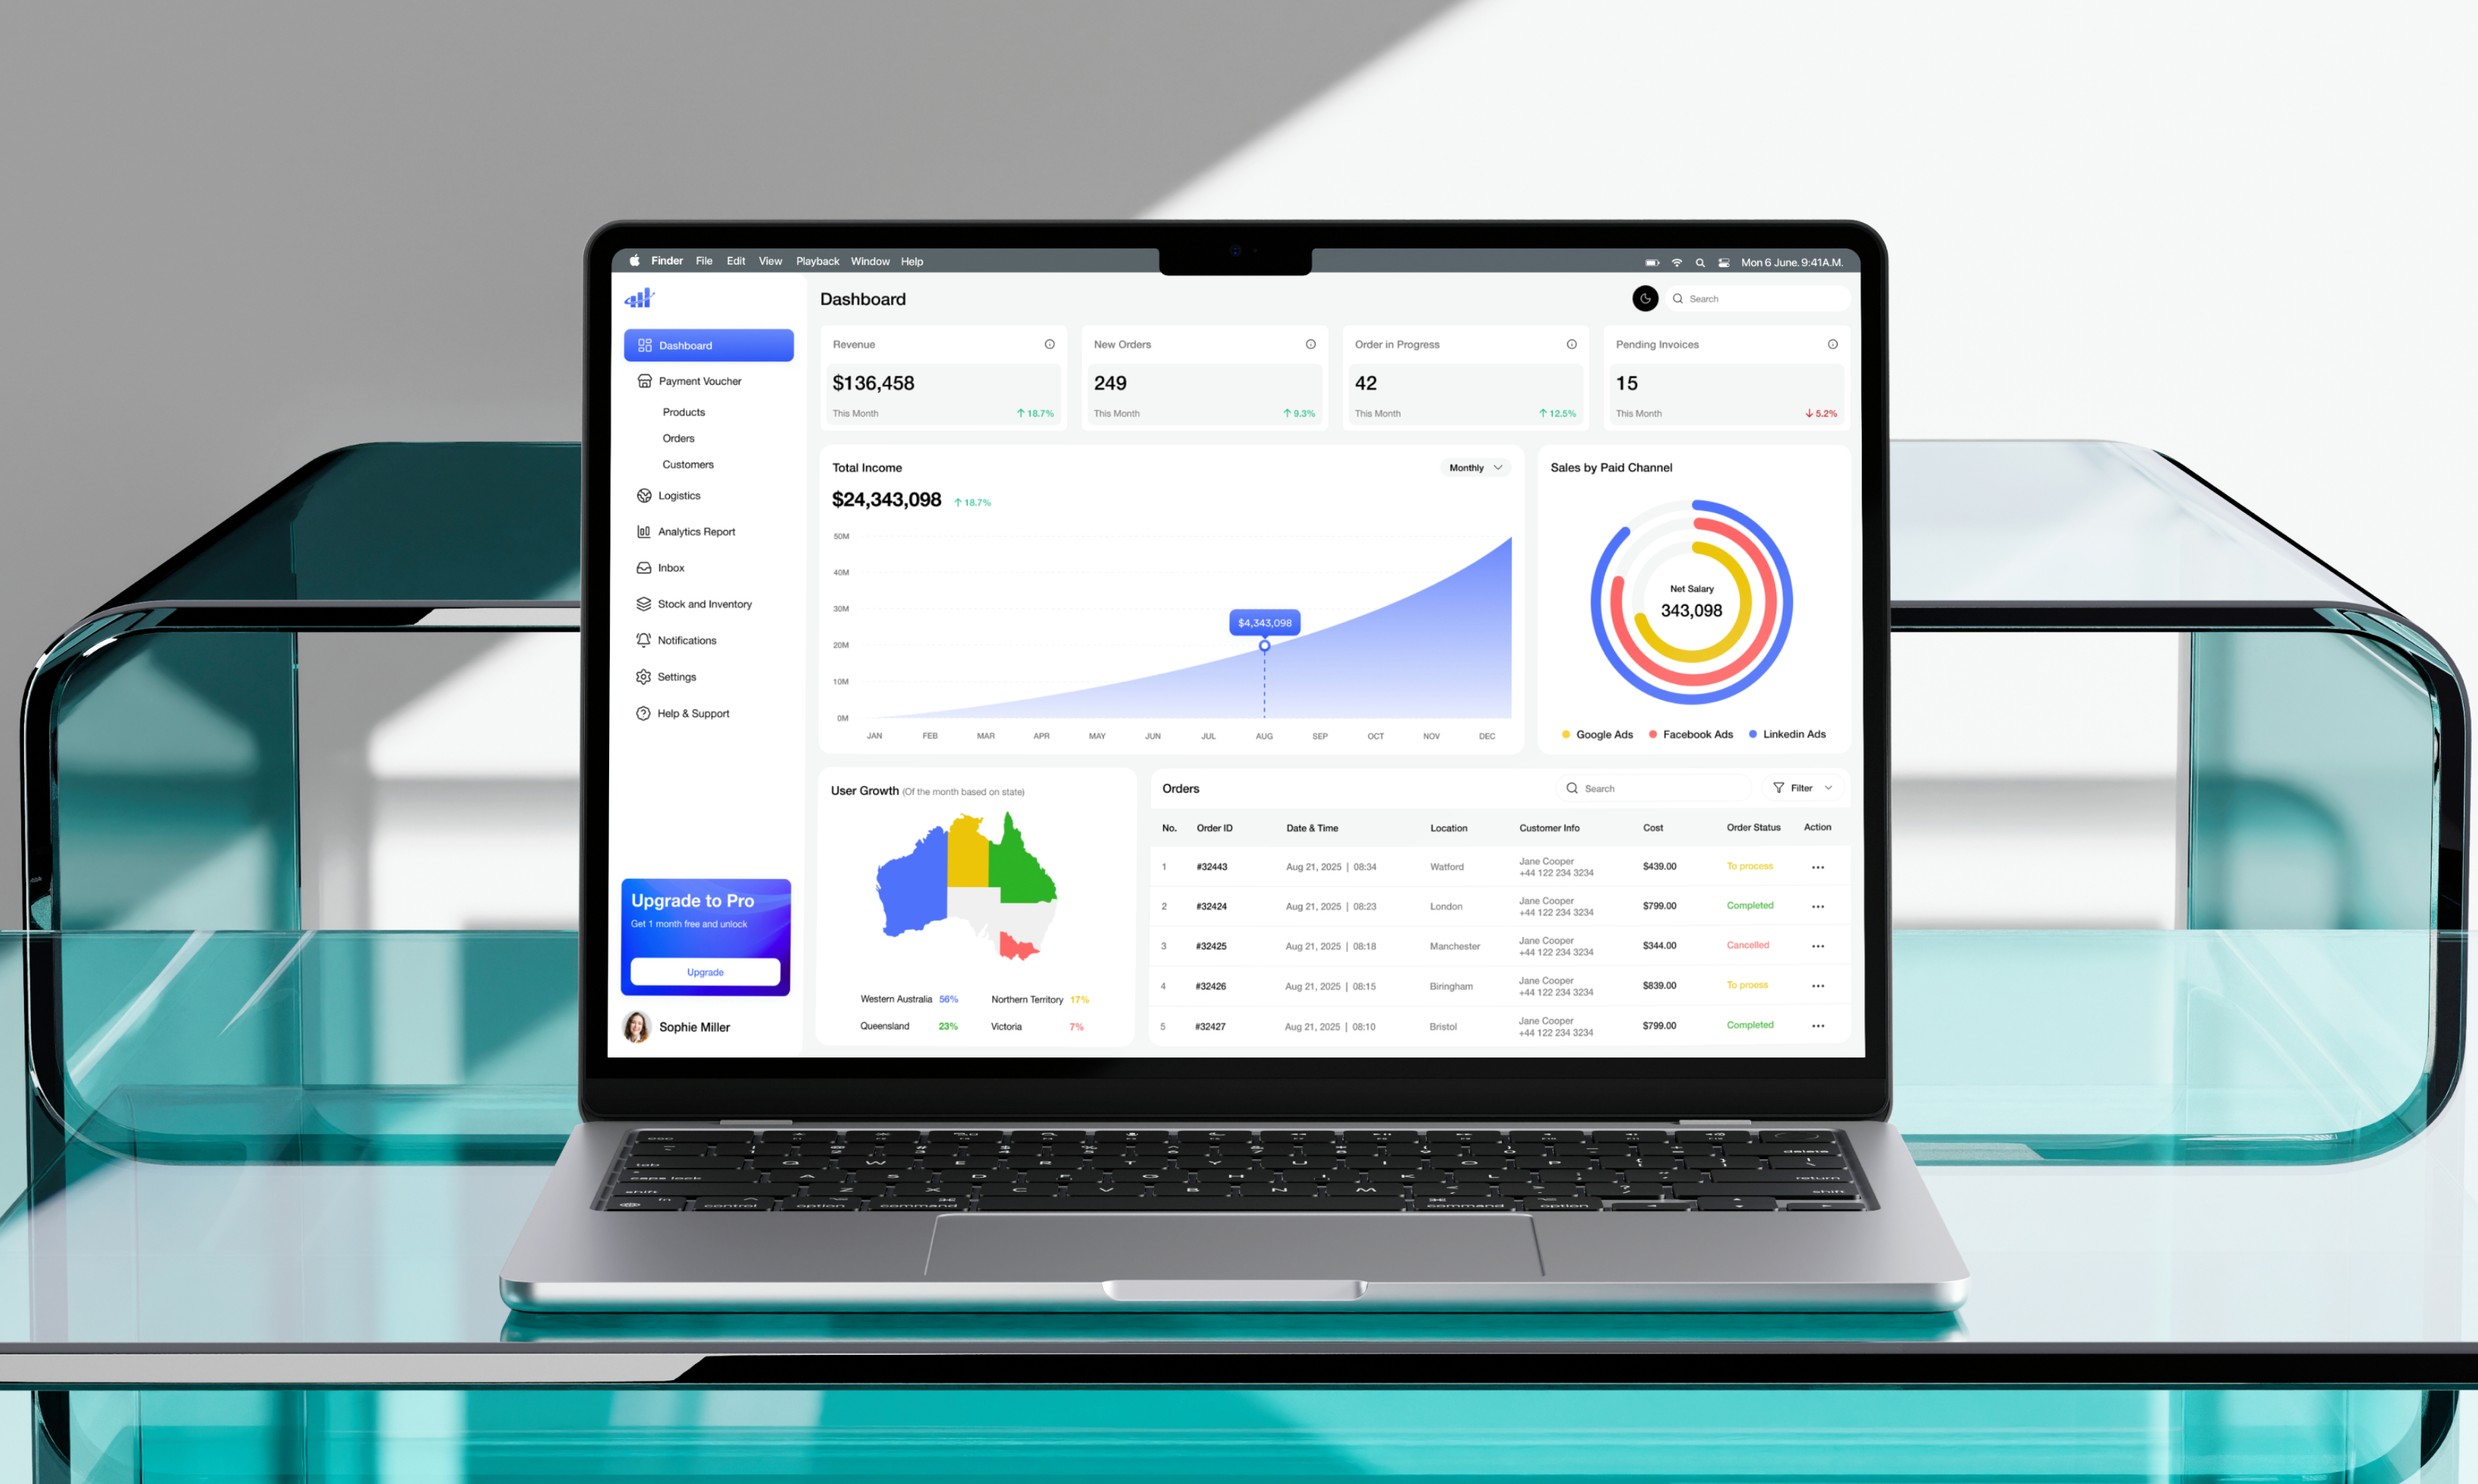
A Smart Business Analytics Dashboard Developed by EncodeDots
Centralized Business Dashboard
EncodeDots developed a powerful business dashboard that brings together revenue analytics, order management, marketing performance, and customer insights into one unified platform. This centralized view helps teams monitor key business activities without switching between multiple systems.
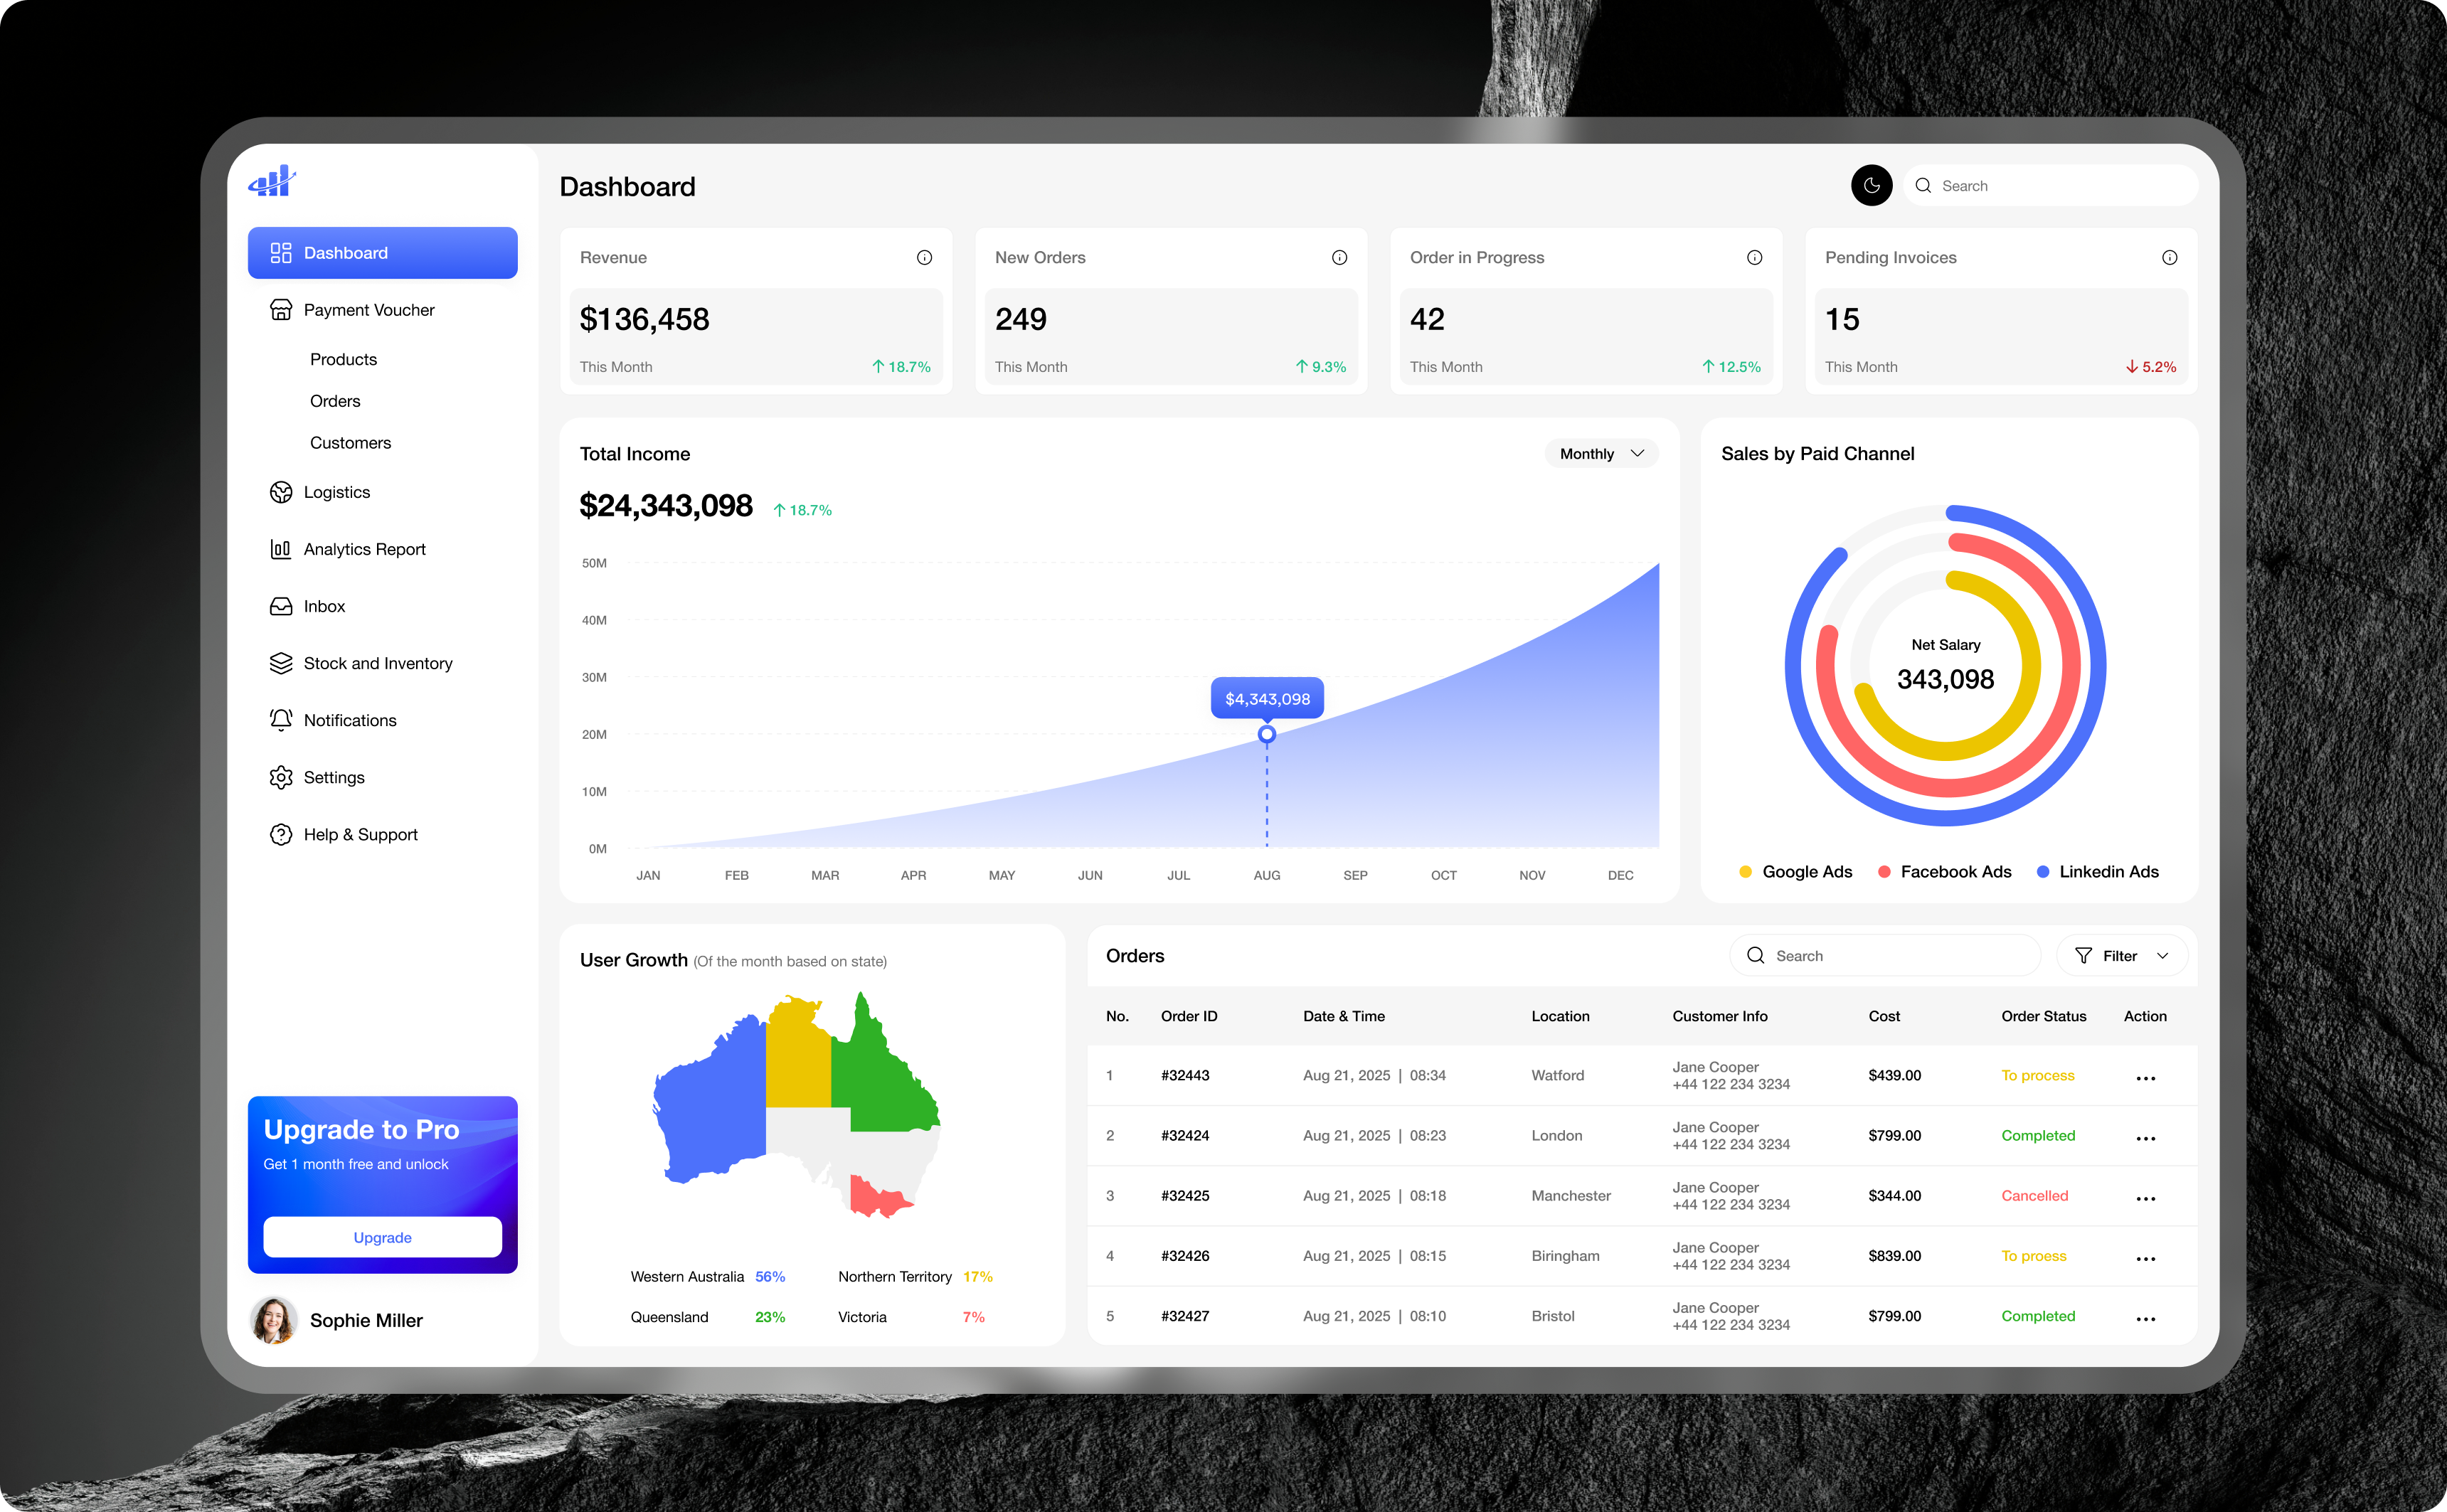
Real-Time Sales Analytics
The platform provides real-time visibility into sales performance through dynamic charts and interactive data visualizations. Businesses can track revenue trends, evaluate sales growth, and quickly understand their financial performance at any moment.
Order & Customer Management
Organizations can easily monitor order activity and customer interactions from a single dashboard. The system helps businesses track order progress, analyze purchasing behavior, and maintain stronger relationships with their customers.
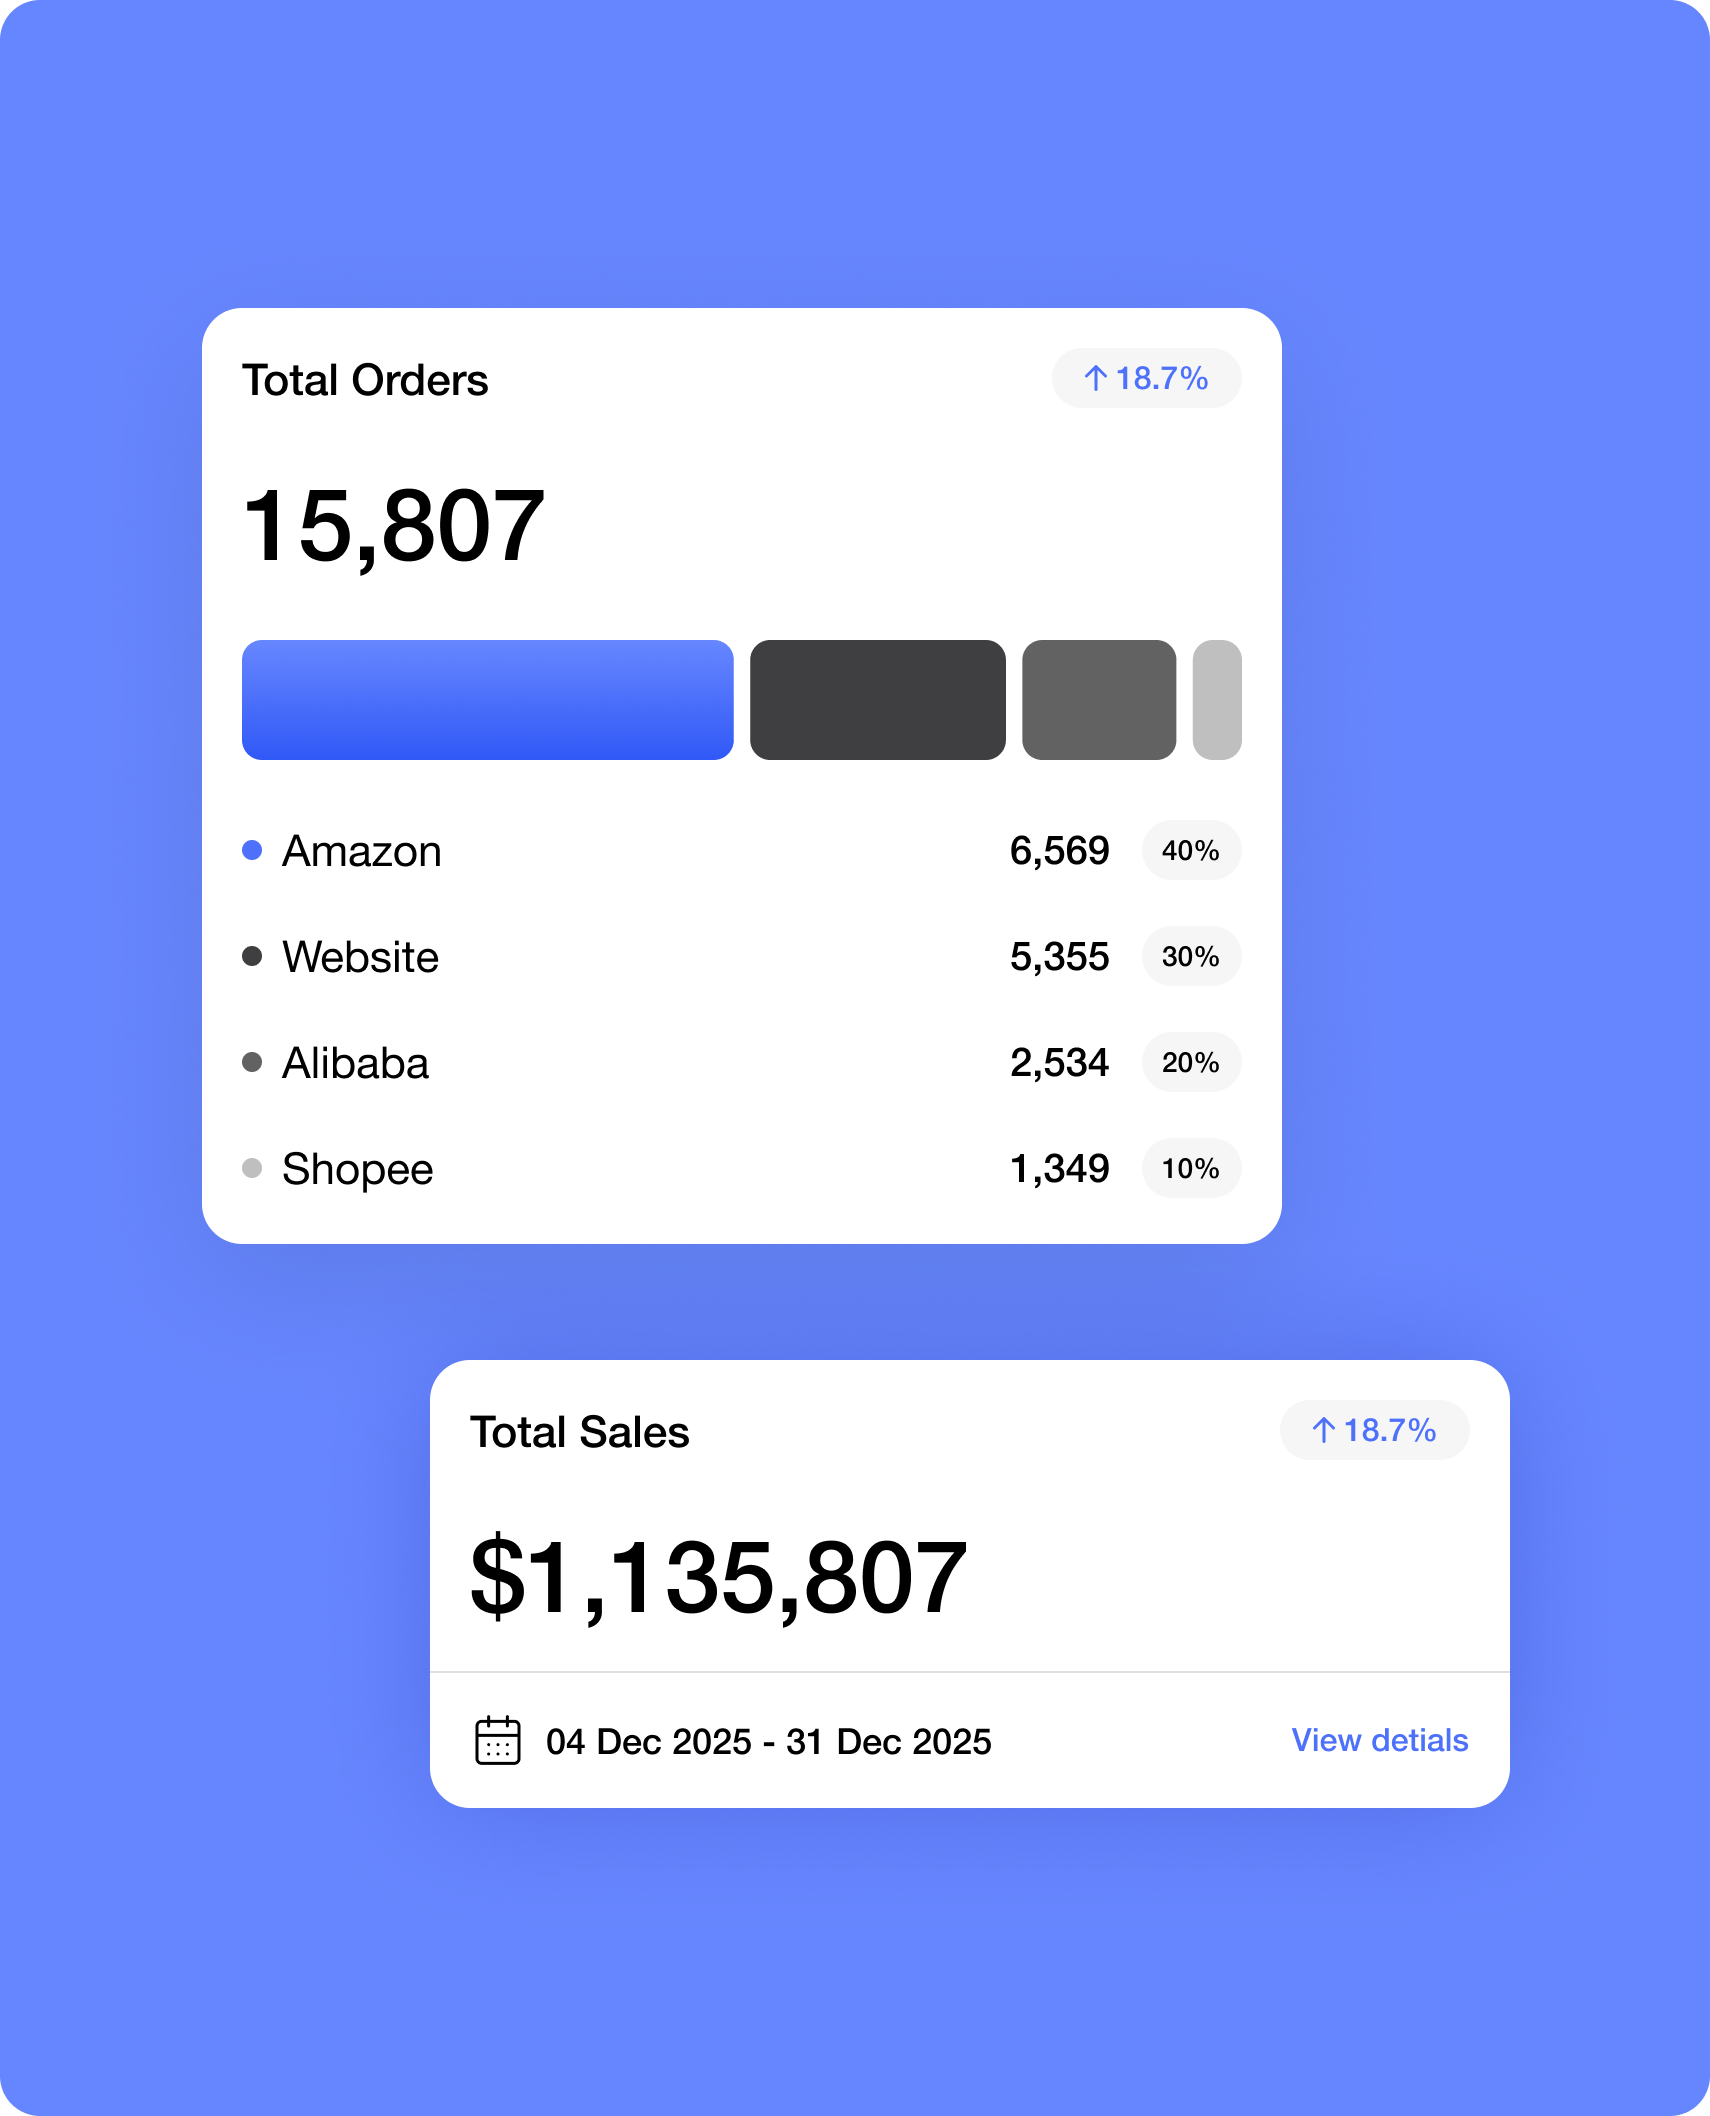
Marketing Performance Insights
The analytics platform enables businesses to measure the performance of different marketing channels and campaigns. With clear insights into campaign results and conversion metrics, teams can optimize their marketing strategies more effectively.

The Impacts
The analytics platform developed by EncodeDots helped organizations transform raw data into meaningful insights while improving operational efficiency and business performance.
42%Increase in Data-Driven Decision Making
37%Growth in Operational Efficiency
95%Improvement in Business Data Accessibility
48%Increase Sales Performance Visibility

Transforming Business Intelligence: How EncodeDots Delivered a Smarter Analytics Platform
Improved Data Visibility
With the advanced analytics dashboard developed by EncodeDots, organizations gained a clearer view of their business performance. Teams could easily monitor revenue trends, customer growth, and operational activities through a single centralized interface.
Faster Strategic Decisions
Real-time analytics and easy-to-understand visual dashboards enabled leadership teams to evaluate performance instantly. This allowed decision-makers to respond quickly to business trends and make well-informed strategic decisions.
Better Operational Management
The platform provided businesses with a centralized system to monitor orders, track inventory levels, and evaluate marketing performance. This improved operational coordination and helped teams manage daily activities more efficiently.
Stronger Business Growth Insights
Detailed performance analytics allowed organizations to discover valuable growth opportunities. By analyzing trends and key metrics, businesses were able to identify areas for improvement and plan strategies for long-term growth.

How EncodeDots Built a Scalable Business Analytics Platform
01.Research & Strategy
- Business Data Analysis
- Market Research
- Analytics Platform Planning
- Data Visualization Strategy
02.Ideation & Planning
- Application Architecture Planning
- User Journey Mapping
- Feature Planning
- Analytics Workflow Design
03.Design Execution
- Brand Identity & Dashboard UI Design
- Wireframe Creation
- High-Fidelity UI Mockups
- Interactive Data Dashboard Prototypes
04.Development
- Frontend Dashboard Development
- Backend API Integration
- Database Architecture & Data Management
05.Quality Assurance & Deployment
- Performance Testing
- Security & Data Protection Checks
- Platform Deployment
- User Feedback Collection
- Continuous Platform Improvements